4.8-bo'lim: Ratsional funktsiyalar
Ushbu yakuniy bo'limda biz ratsional funktsiyalarning grafiklarini muhokama qilishimiz kerak. Ularning qanday ishlashi haqida ko'p ma'lumotga ega bo'lmasdan ham qila oladigan juda oddiy narsadan boshlash yaxshidir.
Keling, \(f\left( x \right) = \frac{1}{x}\) grafigini chizamiz. Birinchidan, bu mantiqiy funktsiya bo'lgani uchun biz nolga bo'linishda ehtiyot bo'lishimiz kerak. Shunday qilib, biz \(x = 0\) dan qochishimiz kerakligini ushbu tenglamadan ko'rishimiz mumkin, chunki bu nolga bo'linishni beradi.
Keling, \(x\) ning ba'zi qiymatlarini kiritamiz va biz nimaga erishamiz.
| \(x\) | \(f(x)\) |
|---|---|
| -4 | -0.25 |
| -2 | -0.5 |
| -1 | -1 |
| -0.1 | -10 |
| -0.01 | -100 |
| 0.01 | 100 |
| 0.1 | 10 |
| 1 | 1 |
| 2 | 0.5 |
| 4 | 0.25 |
Shunday qilib, \(x\) kattalashganda (ijobiy va salbiy) funktsiya \(x\) belgisini saqlab qoladi va kichikroq va kichikroq bo'ladi. Xuddi shunday, biz \(x = 0\) ga yaqinlashganimizda, funktsiya yana \(x\) bilan bir xil belgini saqlab qoladi, lekin juda kattalasha boshlaydi. Mana bu grafikning eskizi.
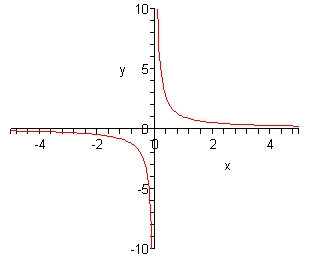
Birinchidan, grafik ikki qismdan iboratligiga e'tibor bering. Deyarli barcha ratsional funktsiyalarda shunga o'xshash bir nechta qismlarda grafiklar bo'ladi.
Keyinchalik, ushbu grafikda hech qanday kesishmalarga ega emasligiga e'tibor bering. Bu o'zimizni tekshirish uchun etarlicha oson.
Eslatib o'tamiz, grafik \(\left( {0,f\left( 0 \right)} \right)\) nuqtasida \(y\)-kesishmasiga ega bo'ladi. Biroq, bu holda biz \(x = 0\) dan qochishimiz kerak va shuning uchun bu grafik hech qachon \(y\) o'qini kesib o'tmaydi. U \(y\) o'qiga juda yaqinlashadi, lekin u hech qachon kesib o'tmaydi yoki unga tegmaydi, shuning uchun \(y\) o'qiga tegmaydi.
Keyinchalik, \(f\left( x \right) = 0\) ni yechish orqali biz grafikda \(x\)-kesish joylarini aniqlashimiz mumkinligini eslaylik. Ratsional funktsiyalar uchun bu tartibsizlik kabi ko'rinishi mumkin. Biroq, bu erda foydalanishimiz mumkin bo'lgan ratsional funktsiyalar haqida yoqimli fakt bor. Ratsional funktsiya \(x\) ning ma'lum bir qiymatida nolga teng bo'ladi, agar bu \(x\) da surat nolga teng bo'lsa va \(x\) da maxraj nolga teng bo'lmasa. Boshqacha qilib aytadigan bo'lsak, ratsional funktsiya nolga teng bo'ladimi yoki yo'qligini aniqlash uchun biz qilishimiz kerak bo'lgan yagona narsa hisobni nolga tenglashtirish va uni hal qilishdir. Ushbu echimlarga ega bo'lganimizdan so'ng, bizga kerak ularning hech biri maxrajni ham nolga tenglashtirmasligini tekshiring.
Bizning holatimizda surat bitta va hech qachon nolga teng bo'lmaydi va shuning uchun bu funktsiyada \(x\)-kesishmalari bo'lmaydi. Shunga qaramay, grafik \(x\) o'qiga juda yaqinlashadi, lekin u hech qachon tegmaydi yoki uni kesib o'tmaydi.
Va nihoyat, grafik \(x\) va \(y\) o'qlariga juda yaqinlashishi, lekin hech qachon kesib o'tmasligi haqiqatiga murojaat qilishimiz kerak. O'qning o'zi haqida hech qanday maxsus narsa yo'qligi sababli, biz \(x\) o'qi haqiqatan ham \(y = 0\) tomonidan berilgan chiziq ekanligidan foydalanamiz va \(y\) o'qi haqiqatan ham \(x = 0\) tomonidan berilgan chiziqdir.
Bizning grafikimizda \(x\) qiymati \(x = 0\) ga yaqinlashganda, grafik \(x = 0\) tomonidan berilgan chiziqning har ikki tomonida juda katta bo'ladi. Bu chiziq a deyiladi vertikal asimptota.
Bundan tashqari, \(x\) ham ijobiy, ham salbiy juda kattalashgani sababli, grafik \(y = 0\) tomonidan berilgan chiziqqa yaqinlashadi. Bu chiziq a deyiladi gorizontal asimptota.
Mana ikkita asimptotaning umumiy ta'riflari.
Asimptotlarning ta'rifi
- \(x = a\) liniyasi a vertikal asimptota agar \(x\) \(x = a\) ga yaqinlashganda grafik chiziqning bir yoki ikkala tomonida chegaralanmagan holda o'sib borsa yoki kamaysa.
- \(y = b\) liniyasi a gorizontal asimptota agar grafik \(y = b\) ga yaqinlashsa, chunki \(x\) chegaralanmagan holda oshadi yoki kamayadi. E'tibor bering, \(y = b\) ga yaqinlashmasligi kerak, chunki \(x\) HAM ortadi, ham kamayadi. Gorizontal asimptota bo'lishi uchun unga faqat bir tomondan yaqinlashish kerak.
Asimptotlarni aniqlash aslida juda oddiy jarayon. Birinchidan, ratsional funktsiyadan boshlaylik,
\[f\left( x \right) = \frac{{a{x^n} + \cdots }}{{b{x^m} + \cdots }}\]bu erda \(n\) hisobdagi eng katta ko'rsatkich va \(m\) maxrajdagi eng katta ko'rsatkichdir.
Keyin bizda asimptotlar haqida quyidagi faktlar mavjud.
Asimptotalar haqida faktlar
- Agar \(x = a\) da maxraj nolga teng bo‘lsa va \(x = a\) da surat nolga teng bo‘lmasa, grafik \(x = a\) da vertikal asimptotaga ega bo‘ladi.
- Agar \(n < m\) bo'lsa, \(x\) o'qi gorizontal asimptota bo'ladi.
- Agar \(n = m\) bo'lsa, \(\displaystyle y = \frac{a}{b}\) chizig'i gorizontal asimptota bo'ladi.
- Agar \(n > m\) bo'lsa, gorizontal asimptotlar bo'lmaydi.
Ratsional funktsiyaning grafigini yaratish jarayoni juda oddiy. Mana.
Ratsional funktsiyaning grafigini tuzish jarayoni
- Kesishmalarni toping, agar mavjud bo'lsa. Esda tutingki, \(y\)-kesishmasi \(\left( {0,f\left( 0 \right)} \right)\) tomonidan berilgan va biz suratni nolga tenglashtirib, yechish orqali \(x\)-kesishmalarini topamiz.
- Maxrajni nolga tenglashtirib, yechish orqali vertikal asimptotalarni toping.
- Yuqoridagi faktdan foydalanib, agar mavjud bo'lsa, gorizontal asimptotani toping.
- Vertikal asimptotlar raqamlar chizig'ini hududlarga ajratadi. Har bir mintaqada har bir mintaqada kamida bitta nuqta grafigi. Bu nuqta bizga grafikning gorizontal asimptotadan yuqori yoki pastda bo'lishini va agar kerak bo'lsa, grafikning umumiy shaklini aniqlash uchun bir nechta nuqtalarni olishimiz kerakligini aytadi.
- Grafikni chizing.
E'tibor bering, biz jarayondan oladigan eskiz juda qo'pol eskiz bo'ladi, ammo bu yaxshi. Grafik nima ko'rinishi haqida asosiy g'oyaga intilayotganimiz shu.
Keling, bir nechta misollarni ko'rib chiqaylik.
Yechim
Shunday qilib, biz kesishmalardan boshlaymiz. \(y\)-kesishmasi bu,
\[f\left( 0 \right) = \frac{6}{{ - 1}} = - 6\hspace{0.25in} \Rightarrow \hspace{0.25in}\left( {0, - 6} \right)\]\(x\)-kesishmalar bo'ladi,
\[\begin{align*}3x + 6 & = 0\\ x & = - 2\hspace{0.25in} \Rightarrow \hspace{0.25in}\left( { - 2,0} \right)\end{align*}\]Endi biz asimptotalarni aniqlashimiz kerak. Avval vertikal asimptotalarni topamiz.
\[x - 1 = 0\hspace{0.25in} \Rightarrow \hspace{0.25in}x = 1\]Shunday qilib, bizda bitta vertikal asimptota bor. Bu endi \(x\) ning ikkita hududi mavjudligini anglatadi. Ular \(x < 1\) va \(x > 1\).
Endi, pay va maxrajdagi eng katta ko'rsatkich 1 ga teng va shuning uchun chiziqda gorizontal asimptota bo'ladi.
\[y = \frac{3}{1} = 3\]Endi bizga \(x\) ning har bir mintaqasida ochkolar kerak. \(y\)-kesish va \(x\)-kesish allaqachon chap mintaqada bo'lgani uchun biz u erda hech qanday ball olishimiz shart emas. Bu shuni anglatadiki, biz faqat kerakli mintaqada ochko olishimiz kerak. Bu erda \(x\) ning qaysi qiymatini tanlashimiz muhim emas, biz uni grafikimizga mos kelishi uchun juda kichik saqlashimiz kerak.
\[f\left( 2 \right) = \frac{{3\left( 2 \right) + 6}}{{2 - 1}} = \frac{{12}}{1} = 12\hspace{0.25in} \Rightarrow \hspace{0.25in}\left( {2,12} \right)\]OK, bularning barchasini birlashtirib, quyidagi grafikni beradi.
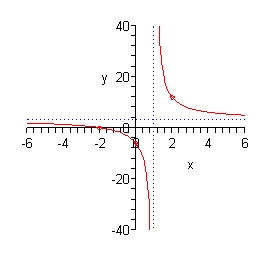
E'tibor bering, asimptotlar nuqtali chiziqlar sifatida ko'rsatilgan.
Yechim
OK, biz kesishmalardan boshlaymiz. \(y\)-kesishmasi:
\[f\left( 0 \right) = \frac{9}{{ - 9}} = - 1\hspace{0.25in} \Rightarrow \hspace{0.25in}\left( {0, - 1} \right)\]Surat doimiydir va shuning uchun hech qanday \(x\)-kesish bo'lmaydi, chunki funktsiya hech qachon nolga teng bo'lishi mumkin emas.
Keyinchalik, bizda vertikal asimptotlar bo'ladi,
\[{x^2} - 9 = 0\hspace{0.25in} \Rightarrow \hspace{0.25in}x = \pm 3\]Shunday qilib, bu holda biz grafigimiz uchun uchta hududga ega bo'lamiz: \(x < - 3\), \( - 3 < x < 3\), \(x > 3\).
Bundan tashqari, maxrajdagi eng katta ko'rsatkich 2 ga teng va hisoblagichda \(x\) lar yo'qligi sababli eng katta ko'rsatkich 0 ga teng, shuning uchun \(x\) o'qi gorizontal asimptota bo'ladi.
Nihoyat, bizga ba'zi fikrlar kerak. Bu erda biz quyidagi fikrlardan foydalanamiz.
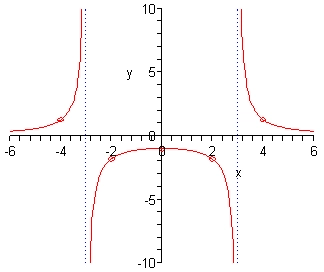
\[\begin{align*}f\left( { - 4} \right) & = \frac{9}{7} & \hspace{0.25in} & \left( { - 4,\frac{9}{7}} \right)\\ f\left( { - 2} \right) & = - \frac{9}{5} & \hspace{0.25in} & \left( { - 2, - \frac{9}{5}} \right)\\ f\left( 2 \right) & = - \frac{9}{5} & \hspace{0.25in} & \left( {2, - \frac{9}{5}} \right)\\ f\left( 4 \right) & = \frac{9}{7} & \hspace{0.25in} & \left( {4,\frac{9}{7}} \right)\end{align*}\]E'tibor bering, \(y\) kesishmasi bilan bir qatorda biz o'rta mintaqada uchta nuqtaga egamiz. Buning sababi shundaki, bu mintaqada bir nechta mumkin bo'lgan xatti-harakatlar mavjud va biz haqiqiy xatti-harakatni aniqlashimiz kerak. Keyingi misollarda biz boshqa asosiy xatti-harakatlarni ko'rib chiqamiz va shuning uchun bu o'sha paytda yanada mantiqiy bo'ladi.
Mana grafikning eskizi.
Yechim
Bu safar e'tibor bering, agar biz \(x = 0\) ni denominatorga ulasak, biz nolga bo'linamiz. Bu shuni anglatadiki, ushbu grafik uchun \(y\)-kesish bo'lmaydi. Biroq, biz allaqachon vertikal asimptotani topishga muvaffaq bo'ldik.
Keling, bizda \(x\)-kesishmalar bor yoki yo'qligini bilib olaylik.
\[{x^2} - 4 = 0\hspace{0.25in} \Rightarrow \hspace{0.25in}x = \pm 2\]Shunday qilib, biz ulardan ikkitasini oldik.
Bizda bitta vertikal asimptota bor, lekin ko'proq bo'lishi mumkin, shuning uchun jarayonni ko'rib chiqamiz.
\[{x^2} - 4x = x\left( {x - 4} \right) = 0\hspace{0.25in} \Rightarrow \hspace{0.25in}x = 0,\,\,x = 4\]Shunday qilib, bizda yana ikkitasi bor va uchta mintaqamiz \(x < 0\), \(0 < x < 4\) va \(x > 4\).
Keyinchalik, pay va maxrajdagi eng katta ko'rsatkich 2 ga teng, shuning uchun chiziqda gorizontal asimptota bo'ladi,
\[y = \frac{1}{1} = 1\]Endi, \(x\)-kesishmalaridan biri eng chap mintaqada joylashgan, shuning uchun u erda hech qanday nuqta kerak emas. Boshqa \(x\) kesishuvi o'rta mintaqada joylashgan. Shunday qilib, bizga eng o'ng mintaqada nuqta kerak bo'ladi va oldingi misolda ta'kidlanganidek, biz uning xatti-harakatlarini to'liq aniqlash uchun o'rta mintaqada yana bir nechta ball olishni xohlaymiz.
\[\begin{align*}f\left( 1 \right) & = 1 & \hspace{0.25in} & \left( {1,1} \right)\\ f\left( 3 \right) & = - \frac{5}{3} & \hspace{0.25in} & \left( {3, - \frac{5}{3}} \right)\\ f\left( 5 \right) & = \frac{{21}}{5} & \hspace{0.25in} & \left( {5,\frac{{21}}{5}} \right)\end{align*}\]Mana bu funksiya uchun eskiz.
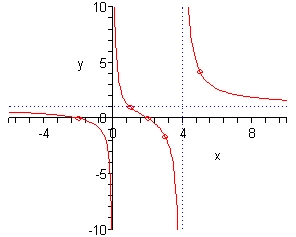
E'tibor bering, bu safar o'rta mintaqa oldingi misolda ko'rganimizdek, asimptotalarda bir xil xatti-harakatlarga ega emas. Bu juda tez-tez sodir bo'lishi mumkin va bo'ladi. Ba'zida ikkita asimptotadagi xatti-harakatlar avvalgi misoldagi kabi bo'ladi va ba'zida bu misolda ko'rib turganimizdek, har bir asimptotada qarama-qarshi xatti-harakatlar bo'ladi. Shu sababli, xatti-harakatlar qanday bo'lishini aniqlash uchun har doim ushbu turdagi mintaqalarda bir nechta ball olishimiz kerak bo'ladi.